SPR-grade sensitivity. Microarray scale.
IRIS measures label-free binding kinetics across dozens of ligands at once, with no reference channel, no bulk-effect correction, and curves that fit the model.
Backed by 18 years
of published results.
IRIS instruments run in more than ten research institutions, and independent groups publish with them. The technology is also the subject of 25 PhD dissertations.
Why it belongs in your lab.
Multiplexed by design
IRIS chips are spotted with different capture agents in a microarray format, so multiple analytes are measured in a single experiment. The same feature makes the platform efficient for antibody and antibody-pair selection during immunoassay development. Discovery programs that train models on binding data need that data in volume: one IRIS run returns a full kinetic trace for every spot on the chip.
Sub-pg/mm² sensitivity
Long term stability allows for high surface binding sensitivity even at very low concentrations. That sensitivity combined with multiplexing makes IRIS ideal for biomarker discovery and disease-specific detection.
Works in real samples
Optical transduction and bulk-effect-free operation make IRIS effective in complex media. Compatible with serum, plasma and cell-culture supernatant, for direct label-free measurement of biologics titre and composition.
Low cost per curve
High sensitivity at a fraction of the instrument cost of SPR or BLI, on silicon substrates made with standard wafer processes. Combined with multiplexing, the cost per binding curve is very low. Chips ship pre-coated, or you coat your own.
How labs already use it.
Six applications, each with a real experiment behind it.
Interferometric reflectance imaging
How our system works.
IRIS quantifies binding as a change in the optical thickness of a Si/SiO2 substrate, imaged per spot across a microarray. No labels, no reference channel, and no bulk-effect correction.
Two reflections interfere.
The substrate is silicon with a thermally grown SiO2 layer. Incident light reflects at the buffer–oxide interface and again at the Si–SiO2 interface, and the two returns interfere. The spectral reflectivity encodes the optical thickness of the layer. This is the baseline.
A standard silicon substrate.
Chips come off standard semiconductor production lines: a silicon wafer carrying a single precisely grown oxide layer, with no metal film and no hydrogel above it. Wafer-scale processing gives chip-to-chip consistency in the oxide thickness the measurement depends on.
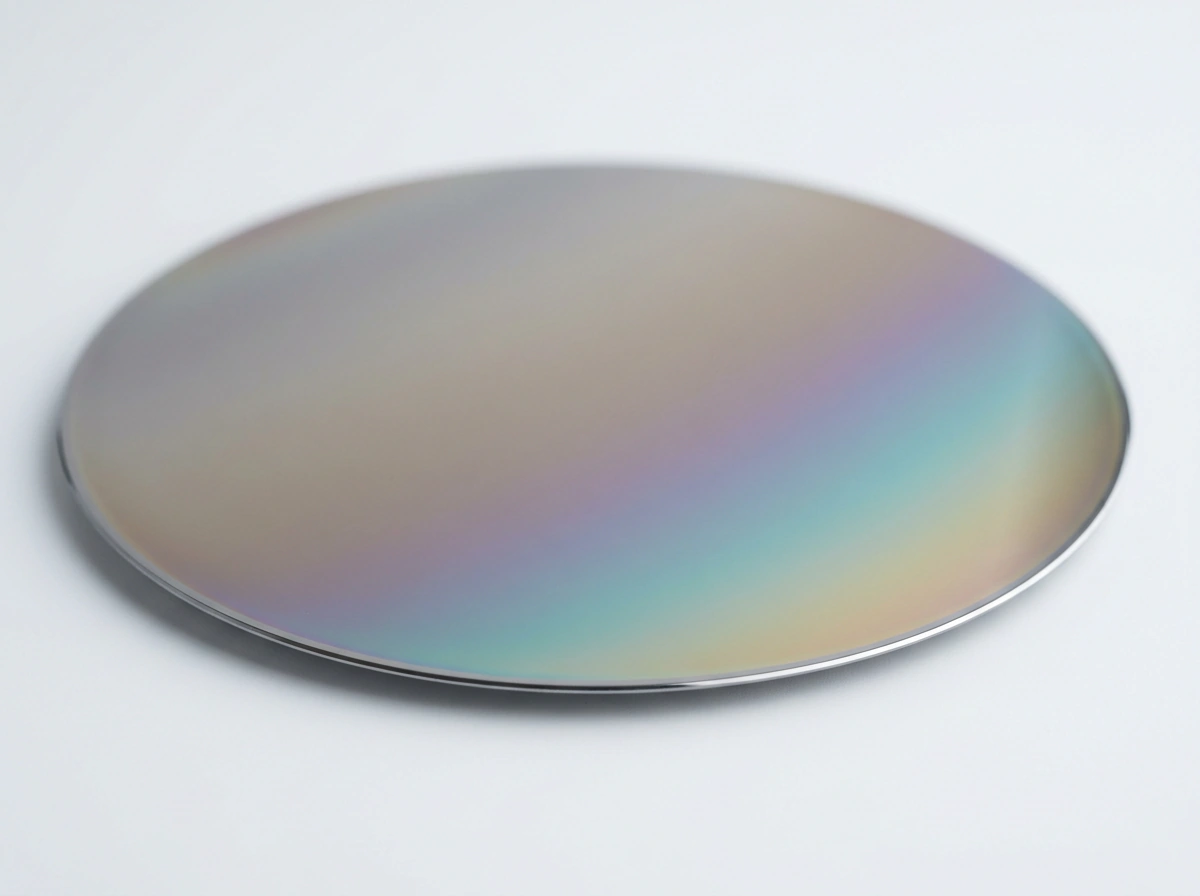
Immobilized probes, printed in replicate.
The oxide surface is functionalised and spotted with capture probes: antibodies, oligonucleotides, receptors. Tens to hundreds of features per array, each printed in replicate, each reporting an independent interaction.
Binding adds optical thickness.
As sample flows across the array, analyte binds its probe and the effective optical thickness at that spot increases. The signal responds only to bound mass: no label, no secondary reagent, and no contribution from the bulk refractive index of the running buffer.
The reflectivity shift is the readout.
Added biomass changes the interference condition, so a loaded spot reflects measurably differently from a bare one. The per-spot shift is converted to bound mass and reported as surface mass density, in pg/mm².
Ensemble read · 6 of 30 ligands · Δ mass, pg/mm²
Our proprietary lighting system means picometer resolution.
Uneven illumination is indistinguishable from bound mass, so evenness sets the noise. Our lighting system diffuses off-the-shelf LEDs in a way that flattens light across the whole chip, making 1 pm of optical thickness readable by the sensor.
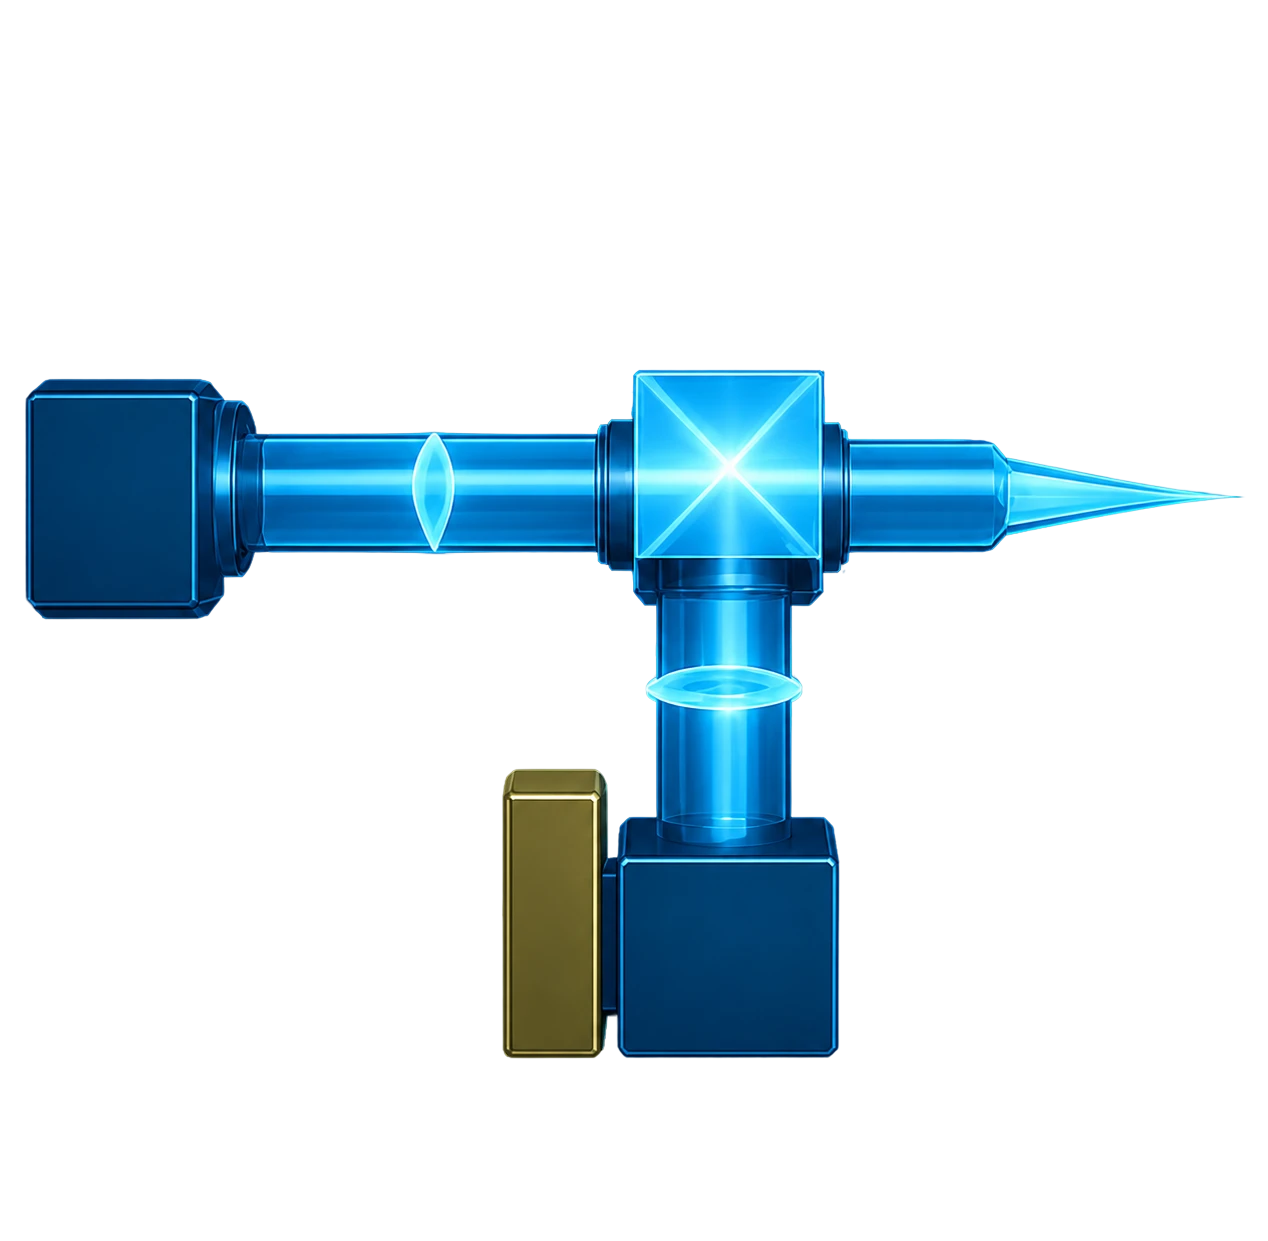 4-Color LEDsEuclid™ Light SourceCollimating LensCritical IlluminationBeam Splitter2x ObjectiveTube LensCMOS Camera
Continuous imaging yields
the full kinetic trace.
Every spot is imaged simultaneously and repeatedly through the run, so each feature produces a continuous record of bound mass against time. The association rate (kon) and dissociation rate (koff) are fitted from that trace for every spot, and the affinity (KD) follows from their ratio, all in a single experiment.
Both figures are surface mass density, which is what the instrument reports. They come from two different experiments and are not a single measurement, so read them as a floor and a worked example rather than as a ratio.
Ensemble mode is label-free, real-time quantification of accumulating biomass by reflectance interferometry, and it is the mode that produces the binding curves above. Digital mode, SP-IRIS, counts single binding events using the interferometric contrast of individual nanoparticles: gold nanorods of roughly 70 by 25 nm act as high-contrast scattering labels, so discrete events are counted and tracked down to attomolar concentrations.
App Note IK-12Kinetics you can trust,
because the data actually fits the model.
Every binding kinetics platform reports a KD. Not every platform’s raw data supports the equation used to calculate it.
A model can be fitted to a distorted trace and it will still return a KD: the number is then what the equation produced, not what the molecules did, which is why the goodness of fit is worth scoring alongside the affinity.
IRIS vs BLI vs SPR
Across dozens of real protein-protein interactions, every fitted curve scored: IRIS stays tightly clustered near a perfect fit in both association and dissociation, where SPR and BLI both show long tails of poor fits.
Proteins and the SPR and BLI dataset were provided by Absea.

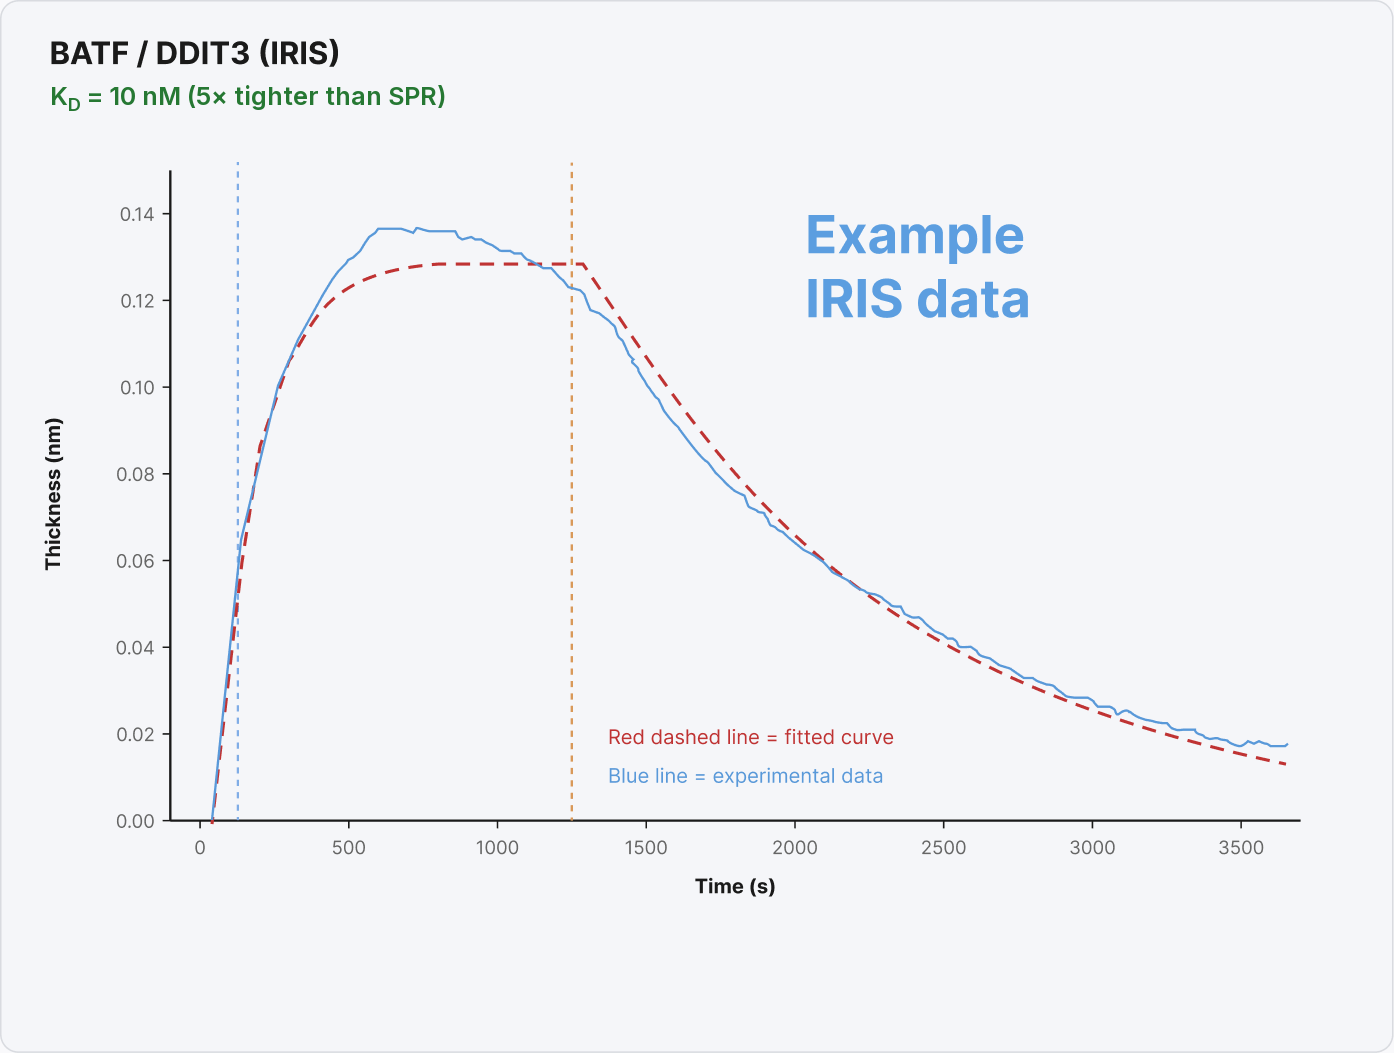
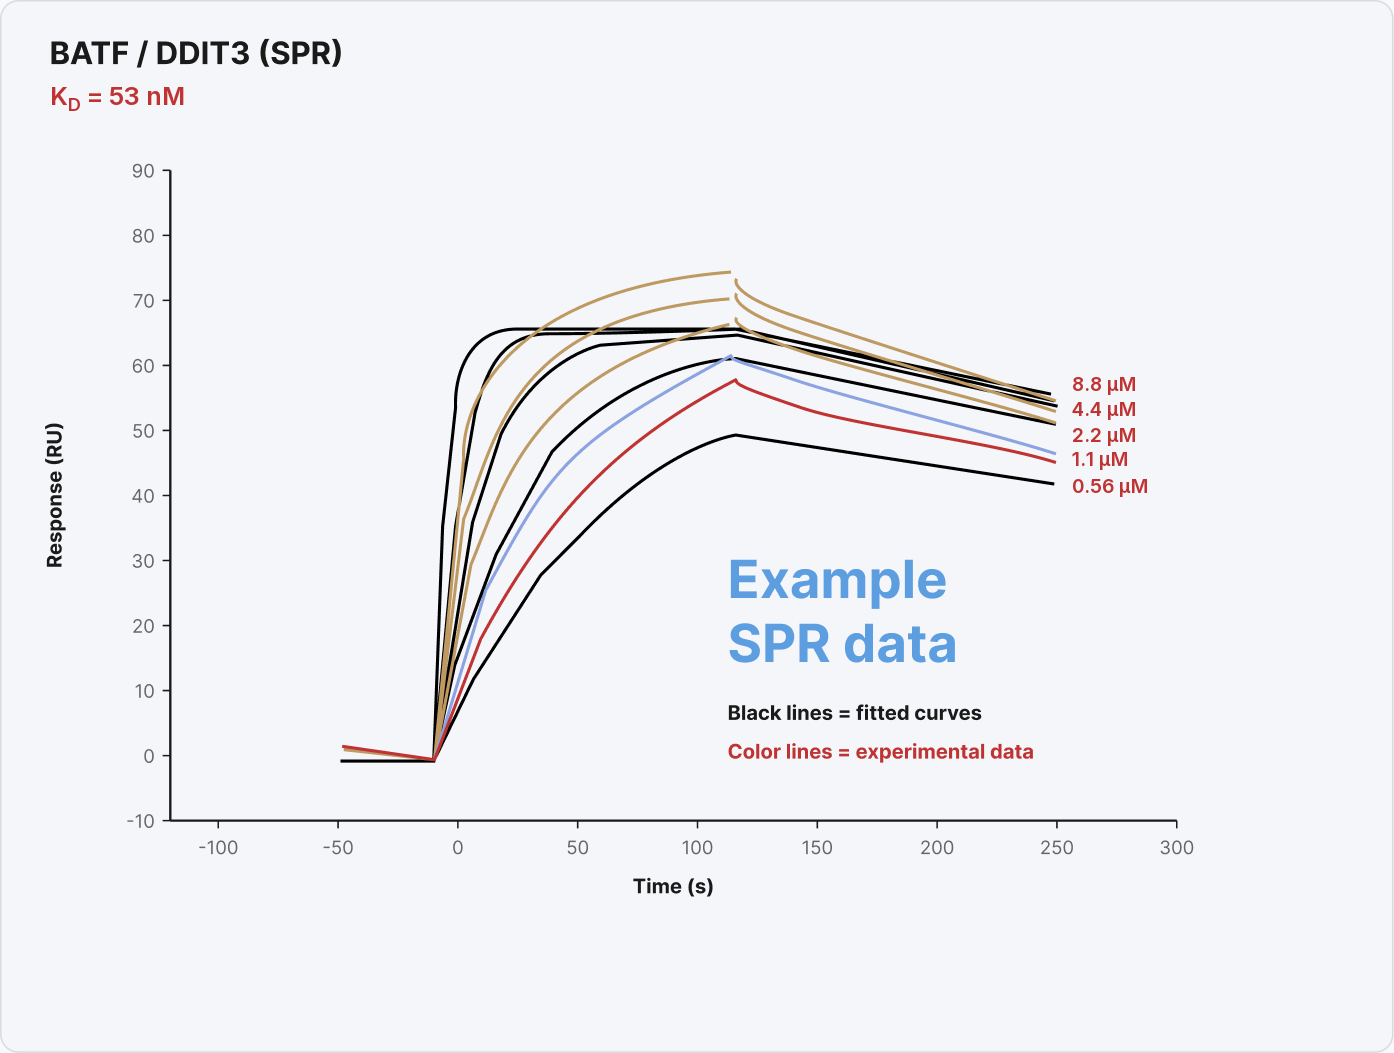
In a published study, more than thirty anti-lethal-factor camelid antibodies were profiled in parallel against injected antigen. IRIS-derived kon, koff and KD agreed with previously published SPR values.
Case study: the ligand
SPR could not see.
JMO-B9 registered nothing on SPR. On IRIS it produced a clean binding curve.
In a screening campaign, that is the difference between discarding a candidate and developing it.
Cleaner curves, less second-guessing
Fewer artifacts means fewer manual exclusions, fewer re-runs, and fewer judgement calls about which concentrations to trust.
Affinities you can defend
A KD is only as good as the fit behind it. In the comparison above, IRIS curves fit their binding model with a median R² of 0.985, a fit you can show alongside the number in a paper or a partner meeting.
A check on data you already have
Run IRIS in parallel with SPR or BLI to catch fits that look fine on the surface but are quietly compromised.
A complement,
not a competitor.
“IRIS is not a replacement for ELISA, SPR, BLI, or electrochemical sensors. It is a bridge.”
Closing the Assay Development Gap, Boston University and IRIS Kinetics, 2026. read the review
If your lab runs SPR or BLI, IRIS is not a rival purchase. It is a second, independent measurement of the same interaction, made by a different physical mechanism, on an instrument that costs a fraction of what your primary platform did. Nothing has to come out of the lab to make room for it.
The system, the chips,
and the workflow.
The instrument
A benchtop system with all fluidics on board: three sample channels, flexible configuration, small dead volume, fully automated experiments, and an onboard computer that ships with a keyboard and mouse. Plug and play.
The MX instruments, MX for multiplex, are the research line: the MX-104 ships today and the MX-200 succeeds it.
The chips
A dual-layer silicon chip with a functionalised surface for immobilizing antibodies, nucleic acids, or other capture molecules, assembled into a flow cell with a gasket and cover glass.
Available pre-spotted, including Protein A, G and A/G in ready-to-use cartridges. Or spot your own: the oxide coating is compatible with standard glass surface chemistries. Truly disposable. No reusing old sensor chips.
Spotting your own
IRIS partners with axiVEND, a distributor of M2-Automation spotters. The iFOUR spotter has been customized with a deck for IRIS chips and preloaded spotting programs, so preparing your own arrays is straightforward.
MX-200 specifications
Successor to the MX-104, coming Q1 2027. This is the published specification for an instrument that does not ship yet: sample volume, flow rate, dimensions and power have not been published for it.
MX-200, July 2026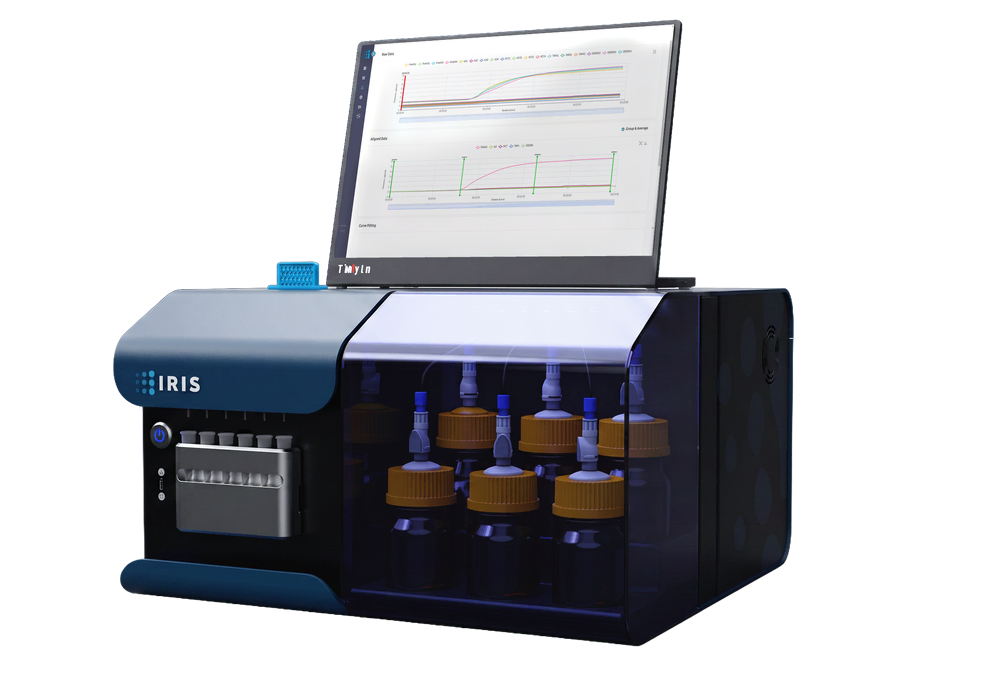
| Multiplexing | Up to 100 biomarkers per run |
|---|---|
| Measurement | Real-time kinetics and endpoint. kon, koff, KD and quantitation. |
| Reference channel | None required. Shot-noise-limited averaging. |
| Bulk-effect correction | None required |
| Format | Benchtop, single instrument |
| Consumable | IRIS Chip, single use |
| Availability | Q1 2027 |
| Sample volume, chamber volume, flow rate, fluidics, dimensions, power | On request from axiVEND |
MX-104 specifications
Shipping today. Current specifications, updated since the July 2025 sheet.
MX-104, July 2025
| Sample volume | 100 µL to 2.5 mL per load (syringe size) |
|---|---|
| Chamber volume | 2 to 10 µL |
| Flow rate | 6.25 µL/min to 5 mL/min |
| Experiment length | up to 400 min per cycle, no limit on cycles |
| Fluidics | 3 sample channels, flexible configuration, small dead volume |
| Sensor area | 5 × 7 mm |
| Channel height | 25 µm |
| Dimensions | 20 × 12 × 9 in |
| Weight | 30 lb |
| Power | 120 to 240 V, 70 W |
| Control | Onboard computer, keyboard and mouse included. Plug and play. |
IRIS MX-series instruments and IRIS Chips are for research use only. Not for use in diagnostic procedures.
The IRIS TX-100, the clinical instrument, is in development, is not available for sale, and is not for use in diagnostic procedures. Nothing on this page describes a cleared or approved product.
Put one in your lab.
Tell us what you are measuring and which instruments you already run. The answer comes back as a configuration and a price.
Request a quote